|
Site Map SEISMIC OBSERVATIONS DURING SEPTEMBER 11, 2001, TERRORIST ATTACK |
|||||||||||||||||||||||||||||||||
|
by Won-Young
Kim
[Undated] Summary Since the time of
plane impact at the Pentagon had often been reported with large scatter,
the United States Army contacted us to inquire whether we could obtain
an accurate time of the Pentagon attack on September 11, 2001 based upon
our seismic network. We analyzed seismic records from five stations in
the northeastern United States, ranging from 63 to 350 km from the
Pentagon. Despite detailed analysis of the data, we could not find a
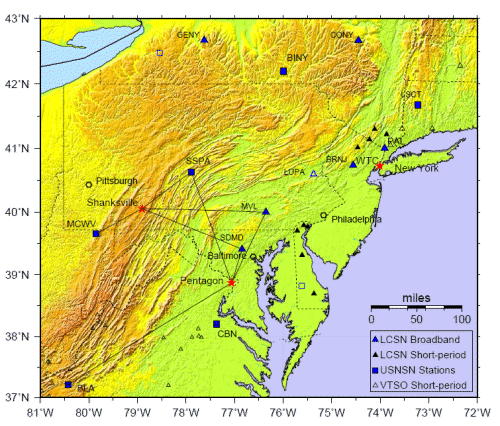
clear seismic signal. Even the closest station ( Introduction Following the September 11, 2001 terrorist attack on the World Trade Center (WTC) towers, scientists at the Lamont-Doherty Earth Observatory of Columbia University were able to determine accurate times of the plane impacts and building collapses using the seismic signals recorded at numerous seismographic stations in the Northeastern United States. The collapse of the WTC towers generated large seismic waves observed in five states and up to 428 km away. The North Tower collapse was the larger seismic source and had a magnitude ML 2.3 (Kim et al., 2001). The time of plane impact at the Pentagon was reported with large scatter. For instance, Cable News Network (CNN) reported 09:43 (EDT), the Washington Post reported 09:40 (EDT), and the New York Times reported 09:38 (EDT). If the plane impact to the Pentagon generated strong enough ground motion that could be propagated through the Earth’s crust as elastic waves (seismic waves) and recorded at sensitive seismographic stations around the source, we could determine absolute time of the impact by using the arrival times of P, S or surface seismic waves. The accuracy of the measured time would depend upon the clarity and strength of the seismic wave arrivals and our knowledge of crustal structure between the source and seismographic stations. This method can provide accurate and absolute time of a seismic event, since most of the modern seismographic stations are equipped with GPS (Global Positioning System) satellite receivers that can provide absolute time usually within one thousandth of a second accuracy. In case of the WTC attack, the impacts of the two planes could be determined with an accuracy of about 2 seconds. Although the impact times are inferred from oscillatory surface wave arrivals, the nearest station, PAL (Palisades, NY), was only about 34 km away from the WTC. Analysis of Seismic Records for Pentagon Attack It was reported by the New York Times (B9, 10/06/2001) that at 09:36 (EDT) the crew of a military C-130 plane identified a Boeing 767 moving low and very fast, and that the plane crashed into the southwest side of the Pentagon at 09:38 (EDT). We collected seismic records from all available seismographic stations in the Northeastern United States around the Pentagon (Table 1; Figure 1) in the hope of verifying or accurately pinpointing the time of impact. The nearest station
to the Pentagon is SDMD (Soldier’s Delight) in Baltimore County,
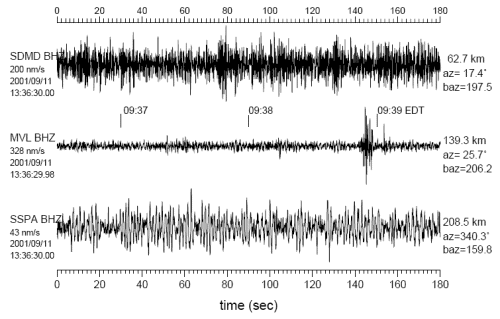
Maryland ( Figure 2 shows
seismic records at the three nearest stations around the Pentagon with
distance ranges from 63 to 208 km. Three minutes of vertical-component
seismic records from 09:36:30 (EDT) to 09:39:30 (EDT) are plotted.
There appears to be strong seismic signals around 09:38:52 at station
MVL (Millersville, Pa;
In case of the plane
impacts to the WTC towers, the observed peak amplitudes on the
vertical-component record at PAL (Palisades, NY;
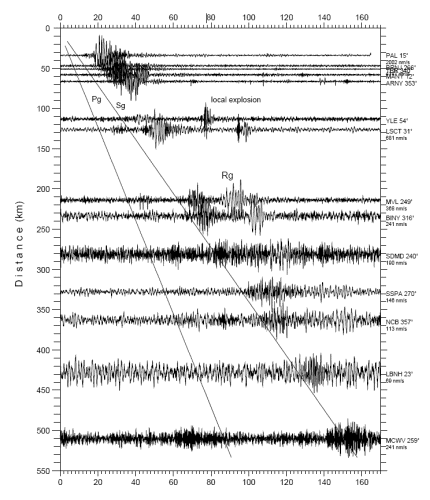
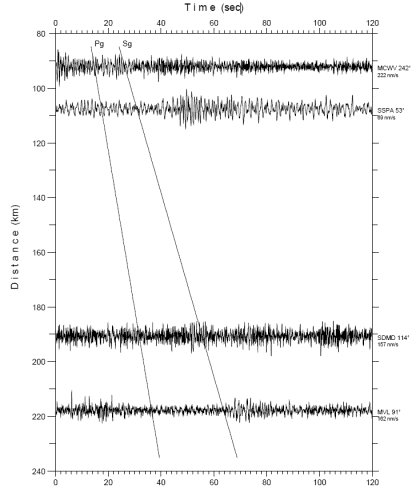
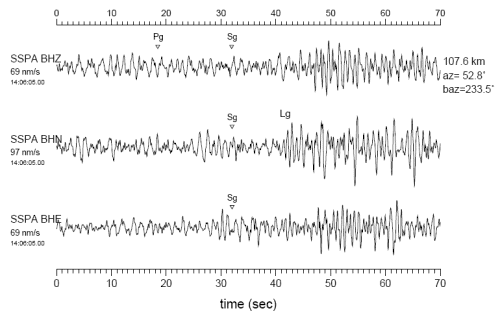
Figure 4 shows seismic record section of vertical seismic records from the WTC South Tower collapse at 11:59:39 (EDT) (13:59:04 UTC). It generated strong seismic waves equivalent to an earthquake of local magnitude ML =2.1 (Richter scale; see Kim, 1998) The seismic signals, Lg and Rg waves, are discernible up to about 500 km from the WTC site. Stations MVL, SDMD and SSPA that we examined for the Pentagon case, also recorded useful signals and indicate that these stations were working normally on September 11, 2001. Analysis of Seismic Records for United Airlines Flight 93 Crash near Shanksville, Pa Figure 5 shows seismic record section of vertical-component records from four stations around the United Airlines Flight 93 crash site near Shanksville, Somerset County, Pennsylvania. The location of the site is taken from the web site for the Flight 93 Memorial, URL http://www.shanksvillememorial.com. The four closest stations range in distance from 92 to 218 km (Table 1). Two minutes of vertical- component seismic records starting from estimated origin time of 14:06:05 (10:06:05 EDT) are plotted. The seismic signals are relatively weak compared with the background noise level. For instance, at stations MCWV and SDMD, the signal (portion of signals just after Sg) to noise (portion of records just before Pg arrivals) ratios are about 1:1, whereas, at station SSPA the ratio is about 2.5:1 and at MVL it is about 2:1 (Figure 5). Although, seismic
signals across the network are not as strong and clear as the WTC case
(see Kim et al., 2001), three component records at station SSPA ( Acknowledgments We thank the many individuals and institutions that collaborated with us in operating the seismographic stations in the Northeastern United States. In particular, Richard Ortt and Robert Conkwright at the Environmental Geology and Mineral Resources, Maryland Geological Survey installed and operate the station SDMD (Soldier’s Delight, Maryland) and provided the digital waveform data for the analysis. Professor Charles Scharnberger at the Millersville University, Pennsylvania operates the stationMVL (Millersville, Pennsylvania) and provided the data. These modern broadband, digital seismographic stations form the backbone of the Lamont- oherty Cooperative Seismographic Network (LCSN). We appreciate LCSN staff Jeremiah Armitage, John Armbruster and John Contino at Lamont-Doherty Earth Observatory for their efforts. Dr. Martin Chapman at Virginia Tech provided the waveform data from BLA (Blacksburg, Virginia). The analysis carried out for this report is sponsored by the Department of Natural Resources, State of Maryland under contract number SMGS/AG1-01-075. References Kim, Won-Young, The ML scale in eastern North America, Bulletine of the Seismological Society of America, 88, 935-951, 1998. Kim, Won-Young, L. R. Sykes, J. H. Armitage, J. K. Xie, K. H. Jacob, P. G. Richards, M. West, F. Waldhauser, J. Armbruster, L. Seeber, W. X. Du and A. Lerner-Lam, Seismic waves generated by aircraft impacts and building collapses at World Trade Center, New York City, Eos, Transactions, American Geophysical Union, Vol. 82, No. 47, pages 565, 570-571, November 20, 2001. Table 1: Seismographic Stations in the Northeastern United States
Seismic Observations on September 11, 2001 Figure 1: Seismographic stations and topography for Northeastern United States. Impacts and crashes of aircrafts during the terrorist attack on Sept. 11, 2001 are indicated by solid stars. Solid triangles and squares indicate stations that recorded seismic signals from WTC, Pentagon and Shanksville, Pa, whereas the open triangles and squares indicate stations either closed or recorded no data. Waveform data used for the analysis are indicated by source-receiver path. Vertical-Component Seismic Records Covering Time Window of Plane Impact at Pentagon on September 11, 2001, 09:36:30 to 09:39:30 (EDT), 0.6-5 Hz Figure 2:
Vertical-component seismic records at three stations around Pentagon.
Three minutes of continuous data shown starting at 09:36:30 EDT
(13:36:30 UTC). Data were sampled at 40 times/s and passband filtered
from 0.6 to 5 Hz. The maximum amplitudes of traces ranges from 200
nanometer/seconds (nm/s) at SDMD ( Vertical Seismic
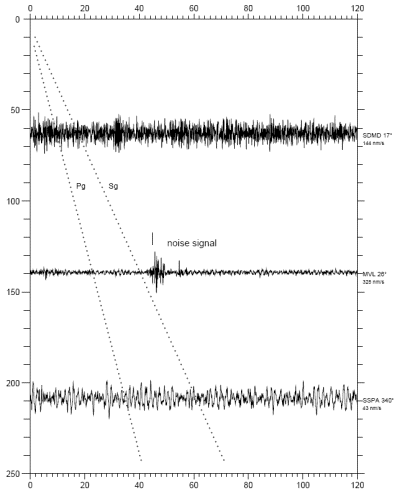
Records for Possible Pentagon Plane Impact on Sept. 11, 2001 Figure 3: Vertical-component records from three stations in Fig. 2. Possible seismic signals from the airplane crash into the Pentagon may be very weak, but examination of seismic data recorded across network of three stations would help identify the signals. Predeicted P- and S-wave arrivals across the network are indicated by dotted lines for a presumed origin time of 13:38:09 EDT. There is no clear seismic signals which can be associated with the airplane crash into the Pentagon. Vertical Records
from WTC South Tower Collapse on September 11, 2001 Figure 4: Vertical component record section from WTC South Tower collapse. S wave arrivals with 3.5 km/s are indicated by solid line, which is usually the beginning of Lg waves. Vertical Seismic
Records for United Flight 93 Crash near Shanksville, Pa. Figure 5: Seismic record section of vertical records from the United Airlines Flight 93 crash near Shanksville, Pa on Sept. 11, 2001. Relatively consistent seismic signals arrivals are discernible at stations, SSPA and MVL. Maximum zero-to-peak amplitude at SSPA is about 140 nm/s. Three-component
Records at SSPA for United Flight 93 Crash near Shanksville, Pa Figure 6: Three-component seismic records, vertical, North-South, and East-West components, at station SSPA from the United Airlines Flight 93 crash near Shanksville, Pa on Sept. 11, 2001. Short-period surface waves, Rg and Lg waves, are quite clear. Maximum zero- o-peak amplitudes on three-component ranges from 160 to 180 nm/s on NS-component. |
|||||||||||||||||||||||||||||||||

